|
|
|
Pearbotham's Law on the Persistence of Achievement Gaps
Men do not make laws. They do but discover them. Prodigy. I hope you didn't mind my knocking, Mentor. I was passing by and it's been so long since our last visit. Mentor. Not at all Prodigy. I want you to meet my friend, Judge Pearbotham. Prodigy. The famous Medal of Freedom winner? Judge Aldan Pearbotham? I am honored. Mentor. You know Prodigy, Judge Pearbotham is retired from the bench. He is now on the faculty of the Barnyard Law School, so we see a lot of each other. He teaches a course in "Race and the Law." We were looking at his final exam for next semester when you knocked. Prodigy. Next semester? Judge. Yes, I write the exams before a course begins. It helps keep me focused on the course goals. Prodigy. Well, I did not mean to interrupt ... Judge. I welcome your input Prodigy, but you must promise not to spill the beans if you are in the vicinity of Grosshall before the course ends. Prodigy. Of course, but I know so little about the law I doubt I can add much. I am, however, curious about legal training in a renowned law school like Barnyard that has produced so many distinguished leaders. This is an extraordinary opportunity for me to learn from none less than Judge Aldan Pearbotham. Judge. Are you considering law as a career? Prodigy. It had crossed my mind. Judge. Well, a good head, a sturdy spirit and an appetite for blood are the basic ingredients of a good lawyer. Ha, ha, ha. Why don't you look at my final exam while I make a call. See what you make of the first question. I won't be ten minutes.
Prodigy. Mentor has kindly offered me the use of his computer. A Web search revealed this case to be similar to one brought in Texas in 1999. There, a coalition of civil rights groups and parents (Forum et al) sued the Texas Education Agency. Plaintiff claimed that because Hispanics and African Americans passed the Texas high school exit exam (TAAS) at lower rates than the majority whites, the test had an adverse impact on minorities and should not be a graduation requirement. In fact, with the exception of the charge of disparate stress, the issues are identical. Judge. Good, my boy! I modeled my question on that case. Prodigy. In its ruling, the Court in Texas acknowledged that the exit exam had an adverse impact on minority students, but it nevertheless ruled against the plaintiffs, saying that adverse impact was "not impermissible." Texas argued, like Flyover, that racial gaps on the exam had narrowed because of the State's efforts at remediation. The Court gave this argument important weight. Judge Prado wrote in his decision: "The Court finds as an inescapable conclusion, that in every administration of the TAAS test since October 1990, Hispanic and African American students have performed significantly worse on all three sections of the exit exam than majority students. However, the Court also finds that it is highly significant that minority students have continued to narrow the passing rate gap at a rapid rate." Though Judge Prado found gap narrowing "highly significant," I am not sure if any real narrowing occurred. It is possible that the perceived gap narrowing might be nothing more than a mathematical artifact. Judge. Mathematical artifact? Prodigy. Yes. A black-white gap shows up on just about every paper and pencil test, SATs, MCATs, LSATs, IQ tests, police and fireman promotional exams and more. Furthermore, the gap is remarkably constant, about one standard deviation (SD) on each test. Claims of gap reductions must be viewed against this experience, that is, cautiously. I think ... Judge. Centuries of slavery and racism have taken their toll on
African Americans. They have been oppressed and depressed, infused with
self-defeating attitudes. Poor performance by African Americans on standardized
tests has been explained by Professor Claude Steele of Stanford. It derives from
the extra pressure brought on by the widely-held expectation that blacks are not
going to do well. That aside, we must not take centuries to undo the damage.
Every advance, no matter how small, needs to be acknowledged and applauded. Any
reduction of any racial gap is cause for celebration. Prodigy. Let's review the facts. In Flyover, from 1995 to the present, the exit exam maintained a constant level of difficulty and a constant passing requirement of 70%. At each administration, African Americans failed at a higher rate than whites. With time, however, pass rates of both blacks and whites increased, black more than white, causing a 12-point reduction ... Judge. Precisely! SATs and MCATs are irrelevant here. We need to consider the facts at hand. When a real effort is made to close a racial gap, progress is made, whether it be in Texas or Flyover. In Flyover, the gap went from 38 points in 1995 to 24 points in just a few short years. With hard work and goodwill we can reduce all racial gaps to zero. The problem, Prodigy, is the goodwill -- or rather the lack of it. Racism clouds every facet of American life. You need to take my course, lad. Prodigy. I would benefit immeasurably from your course, Judge, but
indulge me for a moment more. Imagine a circumstance in which all students were
so weak that almost no one could pass an exit exam. In this event the racial gap
would be vanishingly small because a difference between two near-zero pass rates
is also near zero. Now suppose, because of improved instruction or remediation,
students improved. No longer constrained to zero, a gap would appear. As
students continued to improve the gap would vary, but once again vanish for
similar reasons at the other extreme when all the students became so proficient
that pass rates neared 100%.
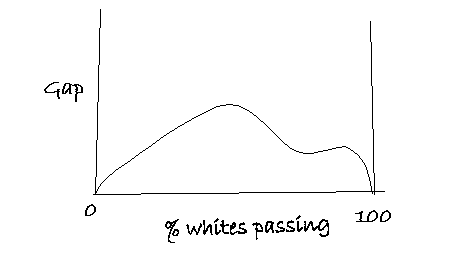 Though we know the achievement gap is some function of student proficiency (measured here by the white pass rate), we do not yet know the function's details. We have learned, however, that because the gap vanishes at its endpoints and is nonzero at points in between, as students improve there will be times when the pass-rate difference will increase and other times when it will decrease. And this variation in the gap, Judge, has nothing to do with real relative changes in group performance. The difference between the mean scores of blacks and whites could remain perfectly constant, while all this is taking place. That is, the perceived gap variation could simply be a mathematical artifact! Judge. Do you mean that there was no real gap reduction in Flyover? Prodigy. Be patient, Judge, all will come out in the wash. First we need to find the function depicted in my sketch. It should not be difficult. Let fW and fB be the fractions of white and black students, respectively, who pass the exit exam. Also, let P(x) and P(x+Δ)
be ability distributions of whites and blacks, respectively. The quantity, Δ, is the mean difference in the ability
distributions. We may then write,
where λ is the passing score (in standard units), and in (1) we have used the transformation:
Equations (1) relate the two passing fractions, fW(λ) and fB(λ), parametrically. The percentage point gap, Δ, is given by
Using (1) and (3) the gap may be evaluated as a function of the white pass rate. I did this while you were out Judge, and plotted up the result for a Gaussian distribution with Δ = 1.0 SD. Have a look. 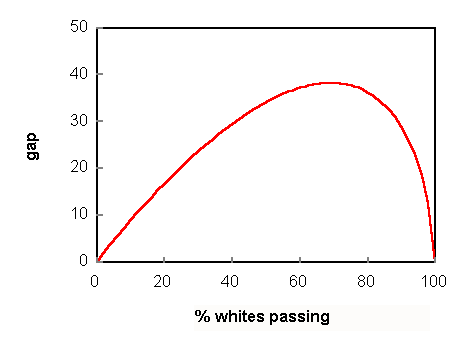 You see, Judge, gaps can come and go without a dime's worth of change in the difference between the mean scores. In this diagram the black-white mean-score difference remains constant at 1.0 SD, while the apparent gap (measured in percentage points) varies all over the map, from zero to near 40. In short:
We can call this Pearbotham's Law. It was, after all, your final exam that inspired it. Judge. Yes! I will frame it and hang it on the wall right next to my Medal of Freedom. Prodigy. That would really impress visitors, especially distinguished ones like Supreme Court Justices. Judge. Indeed! You know if Dukakis had won in '88 I would be sitting
on that bench instead of that Tom. With a new president, Pearbotham's Law might
give me the inside track again. Judge. But Son, there is one little problem. This is all theory. We need to buttress it with facts. The law is about facts! About evidence! Prodigy. Be patient Judge. Lots of data have been accumulated, much of it publicly available. We don't even need the Freedom of Information Act. We have enough to test Pearbotham's Law over a range of pass rates. Here's how. Pass rates can be varied in several ways:
By these methods, used singly or in combination, we can find data to cover a wide spectrum of pass rates. While you were out, Judge, I located pass rates (by race) for several large-scale tests. I used only huge data bases to avoid anomalies that might crop up in smaller data sets, say data from a single US county. One excellent source of test results is the Maryland State Performance Assessment Program (MSPAP). Its tests are given every year and taken by every student in Maryland. Most importantly, the results are reported fully disaggregated by race. MSPAP is an excellent source of data for people who study group differences. Pass rates are reported at both the satisfactory and excellent level, supplying points for low and intermediate pass rates. I located seven consecutive years (1993-99) of eighth-grade MSPAP math results. At higher reaches of competency, I obtained data from three sources. The first, bar exam data, should be dear to your heart. You will be happy to know that a very high percentage of lawyers pass the bar exam, either at a first or subsequent try. The Law School Admission Council, in a huge study, tracked all 27,000 students who enrolled in US law schools in the fall of 1991. It followed them through to the bar exam. The Council issued its report in 1998, including first-time and total pass rates by race. More high pass-rate data came from the benchmark National Board of Medical Examiners (NBME) test required of every medical student in the US. Students take this exam two years before graduation and must pass to become licensed. A comprehensive study of NBME pass rates by race was published in the Journal of the American Medical Association (JAMA, 272:9, 674-9, 1994). It included first-try pass rates for all medical students in the US for the years 1986-88. Finally, at a lower (but still high) pass rate, I obtained first-time pass rates on the California Basic Educational Skills Test (CBEST). Every new teacher in California must pass this exam. Eleven years of test results (1985-95) go into this point. The data are summarized in a table which you may take with you, Judge. Better still, here are the results displayed graphically, suitable for framing and hanging on your office wall. 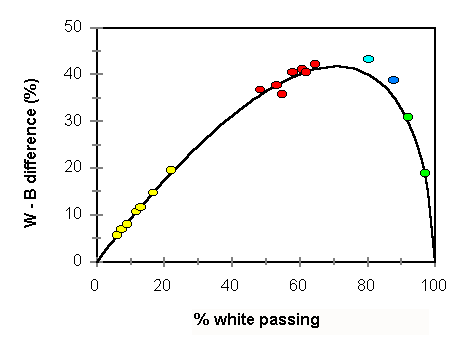 The points are color coded to match the table entries. The function (3) with a 1.1 SD black-white mean difference is plotted for reference. The fit is not too shabby. Judge. What about the Flyover points? Prodigy. Come now, Judge, you made those points up. Judge. Ah, so I did. What about the exit exams in Texas? Prodigy. That was discussed in "Standardized Tests: the Interpretation of Racial and Ethnic Gaps," (La Griffe du Lion, Vol 2, No 3, March 2000). Texas has succeeded in narrowing the 10th grade exit exam gap a bit though not nearly as much as claimed. Judge. I think I am going to lecture on this stuff, Prodigy. Problem is, my audiences will be made up primarily of lawyers, and frankly my boy they are not rocket scientists. I need something that they can grab onto -- something concrete. Prodigy. Can they read a contour map? Judge. What's that? Prodigy. I'm sure you've seen some, like this representation of a hill. Each curve is a contour of constant elevation. At the bottom you're at 100 feet, near the top at 500 feet. 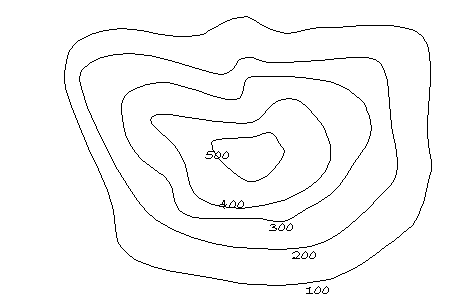 Judge. I think I get it. Prodigy. Good. Now I'll prepare a group-difference "contour
map" for your lawyers. Thus armed, they will be dynamite. 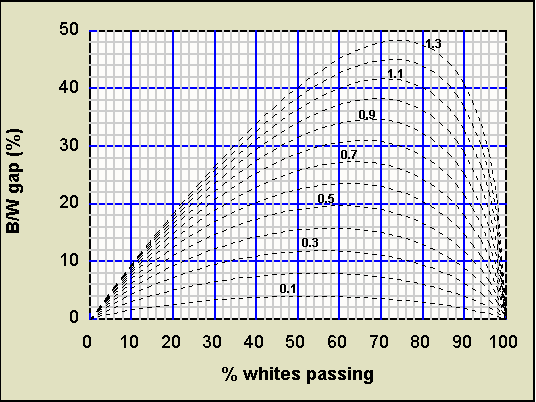
Civil rights lawyers should carry a copy of the map in
their wallets. They can use it in three ways: Finally, there is nothing special about blacks and whites as groups. Any two groups can be compared using the map. Just replace whites with the higher scoring group and blacks with the lower scoring. Sometimes, whites will be the lower group. Asians, for example, usually score higher than whites on math exams. In this case make Asians white and whites Asian. Simple, eh Judge? Judge. It works my boy! Let's put everything together so I can take it with me. I must leave now to deliver a lecture on race relations at the National Black Motivational Society. Would love to stay and chat some more, but I can't be late at $40k a pop. Think how you can put your talents to work for the benefit of the oppressed, to lift up those beaten down by hundreds of years of exploitation. You have many years to serve mankind. Make the right decisions and you will do it well. And be sure to sit in on my course in the fall. Of course, you won't have to take the final exam. Goodbye Prodigy. Goodbye Mentor. The three of us must do this again over dinner. Mentor. Goodbye Aldan, I hope your talk to the Motivational Society is as uplifting as your visit here today. Prodigy. Sometimes, Mentor, you can just feel when you are in the presence of greatness. # # #
|
|||||||||||||||||||||||||||||||||||||||||||||||||||||||||||||||||||||||||||||||||||||||||
# # #