|
||||
|
HOME
Write |
CLOSING
THE RACIAL LEARNING GAP
Mentor. Welcome prodigy, come in. I want you to meet two dear friends, Agnesina and Santo Thurston. Their new book, No Alibis, is causing quite a stir. Prodigy. What a wonderful surprise. I so enjoyed No Alibis. A passion for racial equality shines through every page. Santo. Thank you, Prodigy. Don't you think, though, that Aggie and I are improbable authors of a book opposing affirmative action. After all, I am a former Marxist and Aggie has never fully abandoned her left wing roots. But facts trump politics, and affirmative action has done little to erase the racial skills gap. In fact, it may be argued that affirmative action has helped perpetuate the gap. No Alibis makes that clear. The skills gap is the most important problem facing Americans. When blacks know as much differential geometry as whites, the income gap will disappear. Agnesina. Minority kids need to turn off the TV and buckle down. Only talented teachers, those with the strongest academic skills, should be allowed in the classroom. The others will have to find work elsewhere. Our money would be well spent paying outstanding teachers to teach in schools with predominantly disadvantaged students. Prodigy. Sort of combat pay? Agnesina. At the moment, but changing the environment in urban schools is high on our agenda. Schools can be transformed into safe and orderly places. Mentor. This is all laid out beautifully in your book, Aggie. But I have brought us together today for another purpose. We have a puzzle to solve, one, in fact, identified in No Alibis, but left there unresolved. Each of you brings particular expertise to the table. In addition to your deep involvement with racial injustice, Santo, as Windsor Professor of History you bring to the table the powerful analytic skills of the historian. Agnesina, your superb critical faculties, Civil Rights Committee experience, and political savvy are formidable assets. But time is short; let's get to work. Prodigy. Excuse me, sir, but why am I here? Mentor. Oh, I am sorry, Prodigy. Please apply your extraordinary talents to this problem:
Agnesina. I have been troubled by this too. Santo. It's like using two scales. One says I've lost weight and the other says I've not. How will I know if my diet is working? Mentor. Hmm, scales and diets aside, we will need data to solve the problem. I asked Aggie to bring some. Agnesina. I did better than that. Because I am leaving this evening for Washington to testify before the House Education Committee, I brought all my notes and slides with me. Here is a press release I plan to open my testimony with. September 10, 2003
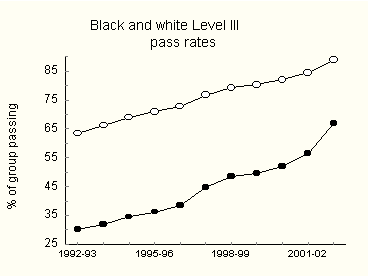
Governor Easley cited data for students in Grades 3-8. In a single year blacks and Native Americans had narrowed their achievement gaps by 6 points each, Latinos by 4. Mentor. I would like to focus on the black-white gap. It has special importance in the US. Without it only academics would pay much attention to performance gaps, and newspapers would have to find other ways to sell pantyhose. There is, however, a more technical reason for concentrating on the black-white gap. Of all, it is the cleanest. Given the collection of schemes for classifying Americans by race and ethnicity, African Americans and non-Hispanic whites form the most homogeneous groups. Asians, for example, depending on who does the classifying, can include Chinese, Filipinos, Japanese, Koreans, Vietnamese, Cambodians, Hmong, Laotians, Thais, South Asians and Pacific Islanders, which further subdivide into Polynesian Hawaiians, Samoans, Tongans, other Polynesians, Micronesians, Guamanians, Melanesians and unspecified others. Some of these subgroups differ cognitively from each other more than whites and blacks do. Accordingly, test-score distributions of Asians are much wider than those of other groups. To some extent the same may be said of Hispanics. Agnesina. In fact, Mentor, most of what I’ve prepared for Congress is about the black-white gap. Check out my first slide (Figure 1). It shows, for Grades 3-8 in North Carolina, rates of passing both math and reading at Level III or better. According to the State, students at Level III "consistently demonstrate mastery of the grade level subject matter and skills and are well prepared for the next grade level." As you see, the performance of both groups has improved impressively.
The next slide, Figure 2, zooms in on the gap. It has narrowed every year since 1996-97. The especially large drop in 2002-03 motivated Governor Easley's celebratory press release.
Mentor. What about Texas? Agnesina. Like Governor Easley, President Bush is also proud of his state's achievements in education. The gains in test scores for both majority and minority students have been so dramatic they have been dubbed the "Texas miracle." The President made it a centerpiece of his 2000 campaign, and he is still talking about it. In an address to the Urban League in July 2003, President Bush observed:
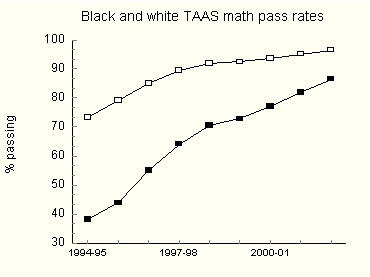
President Bush cited math results for Grades 3-8 and 10 on the Texas Assessment of Academic Skills (TAAS) tests. Percentages were of students meeting minimum requirements defined by the Texas Education Agency. Figure 3 shows nine years of these results.
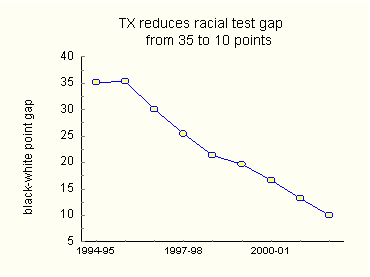
It is plain that the black-white math gap in Texas has been decreasing. Figure 4 shows this more clearly.
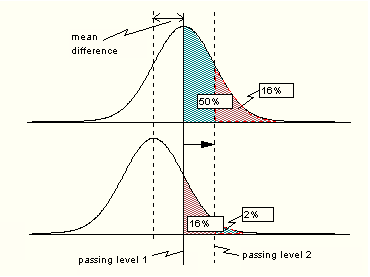
Mentor. Various testing agencies use terms like "proficient," "basic," and "pass" in different ways. In 2000, for example, 81 percent of black eighth-graders passed the TAAS math exam in Texas, but that same year only 40 percent of black eighth-graders performed above basic on the NAEP math test. Perhaps that has something to do with disparities in state and national tests. Prodigy. I think you are correct, Mentor. The point gap is itself a fundamentally flawed construct. It can be altered simply by changing the minimum passing score. Let me illustrate on my laptop. Just a moment. This diagram shows how a point gap can be manipulated by playing with the passing score. Dr. Thurston, you can include it in your presentation to the House Education Committee. Call it Figure 5.
Figure 5 shows typical score distributions for two groups. Shaded areas under the curves beyond the passing level correspond to percentages of students that pass. Raising the bar as shown changes the percentages in a nonlinear way. For the case shown, the pass rate of the higher-scoring group goes from 50% to 16% and the lower from 16% to 2%. Simply changing the minimum passing score has produced a 20 point reduction in the gap. In the hands of an unscrupulous administrator, passing criteria could be set a posteriori to obtain a desired result. There are, as well, other ways to play with the gap. Changing an exam's difficulty can achieve the same result in a more insidious manner. A symmetry exists between the minimum passing score and the test difficulty. Agnesina. It would not surprise me if politicians played such games. Prodigy. It's hard to tell. Real improvement in student performance changes the gap in the same way that lowering the minimum passing score does. It is quite possible that in Texas and North Carolina racial point gap reduction was the result of raising the performance of all groups. Santo. If all groups improve will the point gap necessarily narrow? Prodigy. No. Across the board improvement could also increase the gap. It depends on where the passing score is set. You see, all the variables are related. Santo. This is all too complicated for an historian. Prodigy. Be patient, sir. Things are only complicated until you understand them. Santo. [grinning] I see, there is a symmetry between understanding and complexity. Agnesina. If point gaps can be changed so easily, do they have any meaning at all? Prodigy. Some. If Group A is more able than Group B, an A-B gap will show up on all tests. Playing with the parameters can only change the size of a gap; it cannot completely erase it. Agnesina. Education bureaucrats are a wily bunch. Do you suppose that Governor Easley and President Bush were duped by their Departments of Education into thinking that meaningful gap narrowing occurred? Prodigy. Probably not. Our culture is so steeped in percentages, that ranking groups by the percent that clears this hurdle or that comes naturally to us. Mentor. And what seems natural is not always correct. Prodigy. Precisely Santo. Does this mean we will not be able to learn if North Carolina and Texas reduced their learning gaps in a meaningful way. Prodigy. No, we can know, but it will require a bit more detail. Agnesina. Go for it, Prodigy. Prodigy. Let's see how a point gap might be expected to vary. We make two assumptions.
This approximation is based on a great many observations. The distributions need not have identical standard deviations.
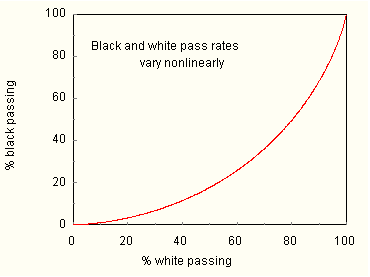
This is closely approximated on all standardized exams irrespective of the scoring system. Under these assumptions, a relationship between black and white pass rates can be established. I'll develop it for you in an appendix, Dr. Thurston. You can show it to the congressmen. But, for now, look at Figure 6. It shows the relationship graphically.
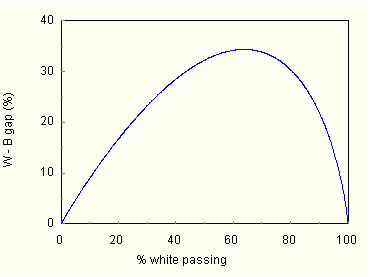
Group pass rates vary non linearly with each other. In the region where pass rates are low, when white pass rates improve black rates improve less. Here, incremental student gains guarantee a gap increase. Raising the level of instruction will only widen the gap, a result that is sure to be dispiriting. It is important, Dr. Thurston, that Congress understand the dynamics of pass-rate relationships else they, under the No Child Left Behind Act, wrongfully punish those who should be rewarded. In Texas and North Carolina pass rates have been improving. Both states are in the high pass-rate region. There, gains in pass rates by whites will be accompanied by even greater gains by blacks. When pass rates are high, incremental student gains guarantee a gap decrease. Whether this be the reason for the gap reductions in North Carolina and Texas remains to be seen. My main point is that gap reductions, rather than reflecting a return on educational investment, can be a formal consequence of mean-score difference invariance. Be patient, all will come out in the wash. Santo. If you are implying the existence of intrinsic group differences, I cannot accept your arguments. Lack of parental involvement accounts for most of the learning gap. Draw parents into the process and the gap will fade away. The condition of education is desperate, and fixing it requires desperate measures. In the cause of racial justice we must declare war on the gap, taking no prisoners, accepting no alibis. Prodigy. I did not mean to offend, sir. You are surely correct. My analysis does not address the cause of group differences. It only asserts that constant mean-score differences, whatever their cause, have formal consequences. And understanding the consequences will enable the solution of Mentor's puzzle. That is all I mean to do. Santo. Please proceed, my boy. Prodigy. Under Assumptions 1 and 2, the dependence of the point gap on performance is easily revealed. (Appendix 1). The white and black pass rates, being linked, are equally suitable as independent variables. Figure 7 shows graphically how the black-white point gap varies with the white rate.
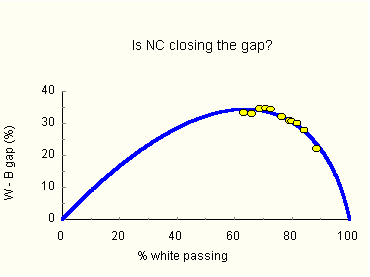
Figure 7. Predicted black-white point gap vs. white pass rate. The predicted gap dependence shown in Figure 7 makes qualitative sense. Suppose an exam is so difficult that very few students pass, both black and white pass rates will be small, and consequently so will their difference. In the high-difficulty limit, the gap vanishes. At the other end, if a test is made so trivial that nearly 100 percent of all students pass, group pass-rate differences must again be small, and go to zero in the low-difficulty limit. Between these extremes the point gap attains a maximum value. Santo. Can you now say if North Carolina and Texas reduced their achievement gaps as claimed by Governor Easley and President Bush? Prodigy. We won't know until we examine the data. May I have them, Dr. Aggie? Agnesina. Here are the tables of pass-rates I've prepared for Congress. Prodigy. I'll include them in Appendix 2. Give me a moment please to plot the data. OK, Figure 8 shows how observed gaps in North Carolina fit the curve predicted by mean-difference invariance.
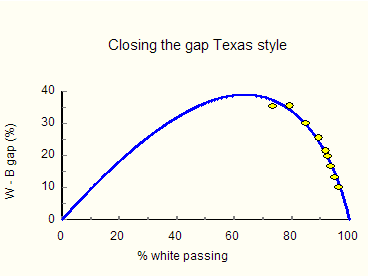
The curve in Figure 8 has two parameters, the black-white mean-score difference and the ratio of standard deviations. These were adjusted to give the best (least squares) fit to observed pass rates. The corrected (see Appendix 1) mean-score difference so obtained was 0.87 standard deviations, reasonable for the tests' g-loading. The black distribution was narrower than the white. Least squares generated a B/W width ratio of 0.92, which may be compared to values of 0.91 observed on WISC-R, 0.9 on the 1986 Stanford-Binet IV, 0.95 typical of math SATs and 0.91 for GREs. Judging by the fit, the gap reductions claimed for North Carolina are artifacts, entirely explained by mean-difference invariance. No meaningful gap reduction occurred in North Carolina. Santo. Have North Carolina's education reforms produced nothing? Prodigy. Not at all. Reforms in North Carolina lifted all groups, a significant accomplishment. Governor Easley should have quit with, "Even in tough economic times our students and our schools are making dramatic progress." Agnesina. In No Alibis we said "the gap is not about IQ." Could it be our recommendations for reform are based on a false premise? Prodigy. People tend to interpret data to fit their Weltanschauung, which is sometimes awash in false premises. In matters of race, this is more the rule than the exception. You know, of course, that given a false premise anything can be proved. Agnesina. Can you prove I am a man? Prodigy. Your premise? Agnesina. Santo is a girl. Santo. [muffled] Bitch! Prodigy. Santo is a girl, but Santo is also a man. Therefore a girl is a man. Aggie is a girl, so Aggie is a man. Agnesina. You naughty boy. Would you like to come with me to Washington tonight? You could learn about congress first hand. Prodigy. What shall I tell my mom? Agnesina. Leave that to me. Santo. Agnesina, please! Allow Prodigy to analyze the Texas data. Prodigy. A moment while I compute the predicted point gaps. OK, Figure 9 shows how observed point gaps in Texas fit the curve of predicted gaps.
In Texas, too, gap reduction followed a predictable course. It appears that President Bush might have been a tad hyperbolic when he declared, "And because teachers rose to the challenge ... that gap has now closed to 10." The best fit was obtained with a corrected (see Appendix 1) mean difference of 0.96 standard deviations and a width ratio of 0.84. Thus, Mentor, the puzzle is solved. Correctly interpreted, the tests tell the same story: In the past decade no meaningful gap reduction occurred in either North Carolina or Texas. Mentor. Thank you, Prodigy. It looks like you have solved the problem. Can you think of how else we might put this analysis to work? Prodigy. Well, an ambitious state official could use it to become the most celebrated education administrator in the US. Mentor. Oh, how? Prodigy. Here's the recipe:
The Thurstons could turn my recipe into a book, say, How to Become the Highest-Paid Most-Celebrated Education Administrator in the US. I think it might sell a lot better than No Alibis. Dr. Aggie, if you suggest to Congress that they rename the No Child Left Behind Act to The Best They Can Be Act, would they listen? Agnesina. Good chance. But if I don't leave for Logan right now, we'll never know. I wish I didn't have to leave. This hour has been delightful. Mentor. Aggie, I know how busy you are between your work on the Civil Rights Committee and promoting your book on TV, but we must find time to do this again soon. Agnesina. I look forward to that. Come with me, Prodigy. Prodigy. Bye all. [Exit Agnesina and Prodigy] Mentor. Let us not be strangers, Santo. Only a short walk across campus separates us. Santo. What a bitch! Mentor. Cosi fan tutte, Santo, cosi fan tutte. APPENDIX 1. Gap
Arithmetic
The point gap, G, is then
These results are independent of any particular test or scoring system. Tests like the SAT, ACT, NAEP or those designed by states will all yield the same functional dependence of G on φW. To produce the curves of Figures 6-9, tedious numerical details
were avoided by using commonly available spreadsheet
functions. Here is how the curves can be calculated in Excel.
Figure 8 and 9 curves were constructed using values of σB and Δ that gave the best least squares fit of calculated to observed gaps. Best Estimate of the Mean-Score Difference
Accounting for differences in black and white sample sizes and distribution widths, a more correct estimate of the
mean difference, Δ',
may be obtained by dividing
From (5) and (6), we can relate the corrected mean difference, Δ', to the uncorrected least squares value, Δ, i.e.,
Corrections for North Carolina and Texas Performing the same calculation for Texas, using the values fB = 0.26, σB = 0.85, and Δ = 0.93, gives for the corrected mean difference, Δ'= 0.97, a 4 percent increase.
APPENDIX 2. Pass Rate Data for North Carolina and
Texas
|
||||||||||||||||||||||||||||||||||||||||||||||||||||||||||||||||||||||||||||||||||||||||||||||||||||||||||||||||||||||||||||||||||||||||||||

