 |
May 2007
WHY MOST SERIAL KILLERS ARE
WHITE MEN
Buried beneath mounds of sociological data, certain quantities hole up waiting to be unearthed. Requiring a bit of digging to expose, La Griffe, with analytical shovel in hand, reveals the criminality distributions for white, black and Hispanic men. From these he proposes two recipes for reducing the black-to-white incarceration ratio.
Remove the absurd from all that has been written about racial disparities, and what's left can be set down in the few lines needed to record intelligence and criminality distributions.
--La Griffe du Lion, 2007
Generally speaking, they are mostly like other men in the penitentiary
population. They are in their 20s. They come from working class or poor
backgrounds. There is nothing that really separates them from the more
general category of criminal offenders except for what they have done. The
crime identifies them but their characteristics are quite similar to the
general penitentiary population. Two years earlier at a meeting of the American Sociological
Association, University of Wisconsin sociologists Pamela E. Oliver and
James E. Yocom posed three questions: 1. Why would the Black-White disparity in imprisonment grow over time? 2. Why would the prison system become increasingly targeted on Black
people? 3. What has been going on in United States race relations to make
racial differences in imprisonment so much worse in the years after the
Civil Rights Movement? An odd pairing -- serial
murderers and racial disparities in imprisonment. Yet much of what follows
describes a relation between the two. Insomuch as the characteristics of serial killers
resemble those
of other criminals, we consider serial murder to lie on a continuum of criminality -- albeit at the high end.
By criminality we mean that collection of traits which when
immoderately expressed
leads to uncivil or criminal behavior, and in the extreme to incarceration.
Aggressiveness,
impulsivity, reckless disregard for safety, egocentricity, and callousness are some of these
characteristics. Criminality, then, as we use the term, is a human quality independent of laws, courts or systems of criminal justice. Some properties of criminality are at once
evident:
When interviewed
by CBC News, Canadian criminologist Neil Boyd described serial
killers
in this way:
1. In any population, a range of criminality is observed. Criminality is not a one-zero attribute.
2. Insofar as criminality is the result of many independent factors, its distribution will be approximately Gaussian in accord with the central limit theorem.
3. Criminality distributions in men and women, and in racial and ethnic groups differ from one another.
Criminality and diversity space
In the essay Intelligence, Gender
and Race, we introduced the
notion of diversity space, using the construct to characterize sex differences
in the distribution of general intelligence. Here, the idea is extended to
criminality and its variation in different populations.
In cognitive diversity space, rates of cognitive achievement are represented by an axis -- one for each group. In criminality diversity space, incarceration replaces cognitive achievement.
The basic idea is that the incarceration rates of two groups, say A and B, are related parametrically by their criminality distributions, i.e.,

where fA and fB are the
incarcerated fractions of Groups A and B, respectively; PA
and PB are the corresponding criminality
distributions; and
Λ
is the minimum criminality required for incarceration.
Figure
1 depicts the diversity space of hypothetical Groups A and B. The curves
were generated from Equations 1 using Gaussian distributions of
criminality and varying the parameters. Each curve corresponds to a
specific choice of parameters.
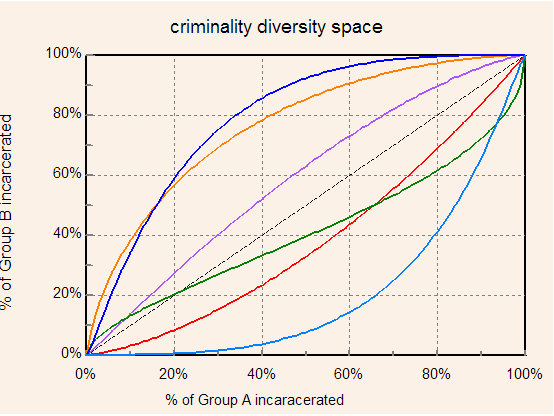
Figure 1. Loci of points in the diversity space of hypothetical Groups A and B. The curves were generated from Gaussian criminality distributions using a different set of parameter values for each curve. The dashed line through the origin with unit slope corresponds to A and B having identical criminality distributions.
Justice changes with the times. The tough-on-crime political climate of the past few decades caused prison populations to swell, but at different rates. Minority imprisonment grew fastest. As the gap between whites and minorities widened, tons of interpretive commentary were generated, and more than a few doctoral dissertations were spawned. The fact is, however, that incarceration rates precisely followed trajectories in diversity space predicted by Equations 1.
Incarceration
rates are a window on criminality. When plotted in diversity space,
the rates trace out a path belonging to the family of curves illustrated in Figure 1,
and determined
by underlying criminality distributions. Finding the distributions,
then, is simply a matter of identifying which of
the infinity of curves in the family has been traced out.
Incarceration statistics
The Bureau
of Justice Statistics (BJS) assembles and makes public national incarceration data
disaggregated by race and ethnicity. But raw incarceration rates are not suitable axes
for diversity
space. The problem with raw data is that they do not include ex-prisoners. Living ex-prisoners, however, are as important to the
assessment of group criminality as the current crop. In
2001 former prisoners
accounted for 77% of all adult U.S. residents who had ever been
incarcerated. Omitting them from the analysis would seriously distort its outcome.
Another problem surfaces in periods of rapid demographic flux. Many prisoners are in the middle and terminal stages of long sentences. Fast growing groups like Hispanics have fewer such prisoners because their population was appreciably smaller when these sentences began. As a result, criminality in these groups may be underestimated.
Both difficulties can be overcome. For selected years between 1974 and 2001, BJS statisticians have estimated the number of people ever sentenced to State or Federal prison. The estimates, broken down by gender, race, ethnicity and age are reported in the BJS publication "Prevalence of Imprisonment in the U.S. Population, 1974-2001." (Regrettably, no estimates were made for Asians.) Figure 2 is a graphical representation of the BJS data for adult black, Hispanic and white males.
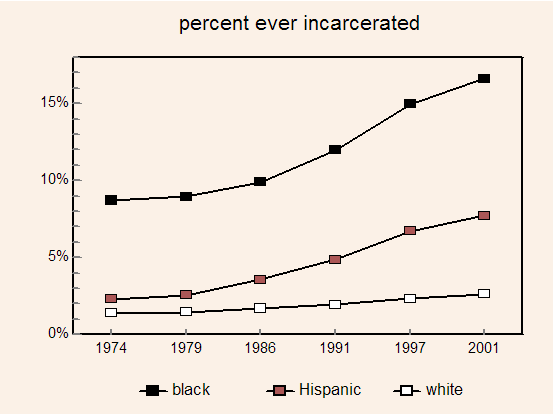
Figure 2. Percentages of adult black, Hispanic and white males ever sentenced to State or Federal prison. Source: Bureau of Justice Statistics; "Prevalence of Imprisonment in the U.S. Population, 1974-2001."
A second BJS tabulation is also useful. From mortality and incarceration data, BJS demographers have estimated the lifetime likelihood of being confined at least once in a State or Federal prison. The estimates, for selected birth years between 1974 and 2001, disaggregated by race, ethnicity, age and sex can also be found in "Prevalence of Imprisonment in the U.S. Population, 1974-2001."
Some extraordinary results emerged from the lifetime-likelihood calculations such as the conclusion that a black male born in 2001 has a 32 percent chance of being imprisoned at least once in his lifetime. Figure 3 displays, by birth year, lifetime likelihoods of incarceration for black, Hispanic and white males.
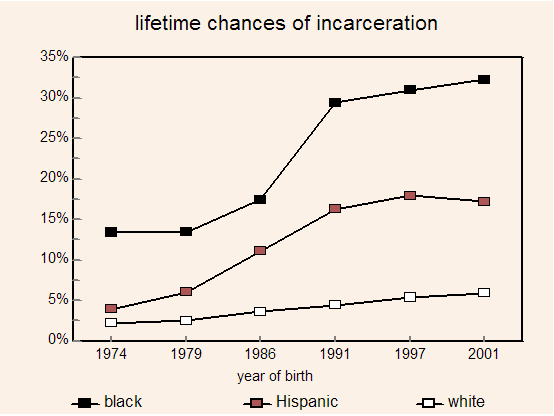
Figure 3. Lifetime likelihood of being sentenced to State or Federal prison for black, Hispanic and white males. Source: Bureau of Justice Statistics; "Prevalence of Imprisonment in the U.S. Population, 1974-2001"
Criminality distributions
Parameters in the criminality distributions
of white,
Hispanic and black males were adjusted to find the trajectories in diversity
space that best fit the BJS ever-incarcerated and lifetime-likelihood data.
The procedure is described in the Appendix
to Intelligence, Gender and Race.
(Substitute
"criminality" for "g," and
"incarceration rate" for "cognitive threshold"
wherever these terms appear.)
Figure 4 shows the trajectory
in black-white diversity space traced out by the BJS data together with
the path predicted by Gaussian distributions of criminality. As is evident, the fit is
excellent.
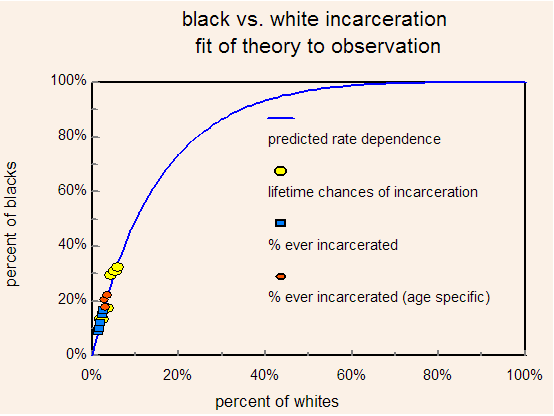
Figure 4. Least-squares fit of BJS incarceration data for black and white males to the trajectory in diversity space derived from Gaussian criminality distributions.
Figure 5 shows a closeup of the fit.
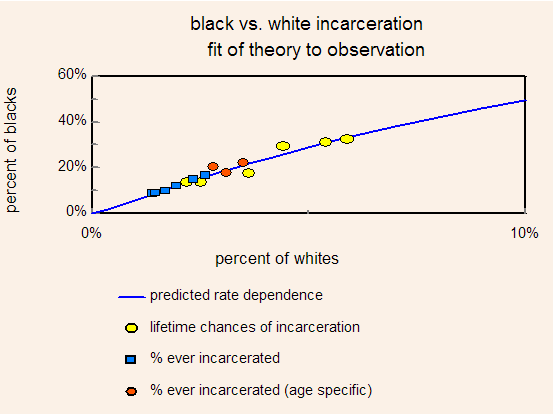
Figure 5. Closeup of the fit of BJS incarceration data for black and white males to the trajectory in diversity space derived from Gaussian criminality distributions.
Figures 6 and 7
are the corresponding graphs for Hispanic and white
males.
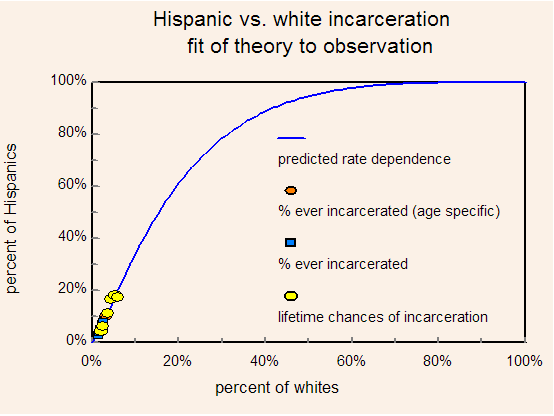
Figure 6. Least-squares fit of BJS incarceration data for Hispanic and white males to the trajectory in diversity space derived from Gaussian criminality distributions.
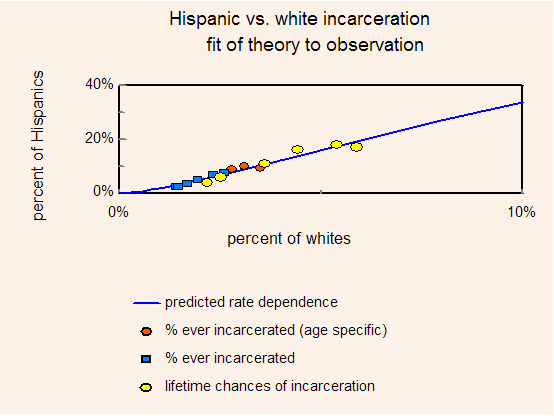
Figure 7. Closeup of the fit of BJS incarceration data for Hispanic and white males to the trajectory in diversity space derived from Gaussian criminality distributions.
As seen above, in Figures 4 - 7, twenty-seven years and
several kinds of incarceration data fall on a single curve in diversity
space -- one of the family of curves generated from Gaussian distributions
of criminality. We infer from this that criminality
distributions for white,
black and Hispanic men have persisted unchanged for more
than a quarter century.
Parameters of the
distributions are listed in Table
1. Standard Mean Variance Ratio black 0.676 1.269 0.458 Hispanic 0.630 1.018 0.397 white 1.0 0 1.0
Table 1.
Gaussian criminality-distribution parameters for black, Hispanic and white males. The
white distribution is taken as the reference distribution. Its mean
is set to zero,
and its standard deviation to
unity.
Normalized criminality distributions for adult white,
Hispanic and black males are shown in Figure 8. They are
accurately drawn using the parameters in Table 1.
Deviation
Criminality
(x/white)
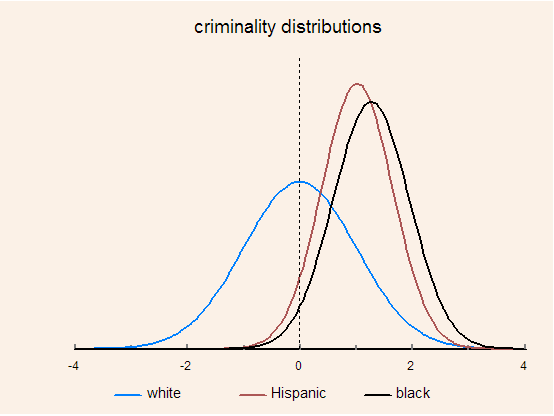
Figure 8. Criminality distributions of white, Hispanic and black men. The abscissa is marked in standard deviation units of the white distribution.
Profound differences between white and minority criminality distributions are evident in Figure 8. There is a white-black gap of 1.27 SD and a white-Hispanic gap of 1.02 SD (both in units of the white standard deviation). Also conspicuous is how narrow the minority distributions are compared to the white. The black-to-white variance ratio is just 0.458, and the Hispanic-to-white ratio is even smaller at 0.397. Black and Hispanic men form remarkably homogeneous groups, each displaying relatively modest variation within their ranks.
The contrast between white and minority variance is better visualized when viewed with a common origin (Figure 9).
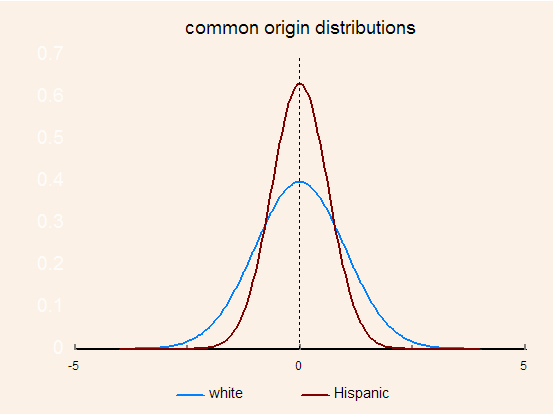
Figure 9. Criminality distributions for Hispanic and white men plotted with a common origin.
Reducing the
black/white disparity ratio
A standard way of gauging
racial disparities in the criminal justice system is via the disparity
ratio -- the ratio of minority to white incarceration rates. Numerical values of the ratio
vary depending on how incarceration rates
are defined. Because we are concerned with criminality, meaningful rates
must include former as well as current
prisoners.
What happens to disparity ratios when general levels of incarceration change? Consider the black-to-white ratio. We have already established a relationship between white and black incarceration rates (Equations 1). Consequently, finding how a ratio of these two quantities varies with either rate it is a straightforward affair. Figure 10 shows how the disparity ratio is predicted to vary with white incarceration. The curve in Figure 10 was generated using the criminality-distribution parameters in Table 1.
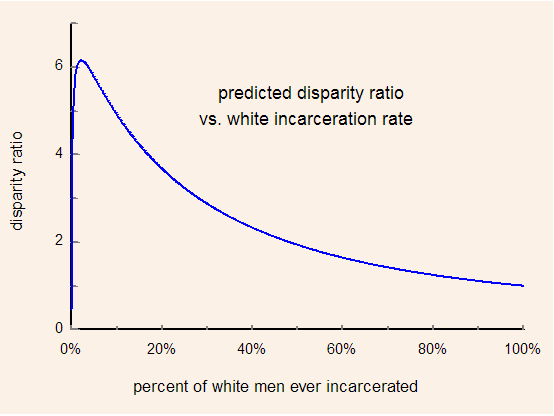
Figure 10. Predicted variation of the black/white disparity ratio with white incarceration.
Incarceration rates skyrocketed in the years for which we have suitable BJS data (1974 - 2001). But despite substantial increases in the prison population -- white incarceration increased by 86% -- the black/white disparity ratio held fast at 6.2 + 0.18.
Though the entire range of white incarceration, 0% to 100%, is formally possible, only a tiny part of this range is ever observed. Between 1974 and 2001, for example, the percentage of white men ever serving time in State or Federal prison varied from a low of 1.4% in 1974 to a high of 2.6% in 2001. Coincidentally, this range is where the black-to-white disparity ratio changes most slowly (Figure 11). At the levels of white incarceration seen between 1974 and 2001, the predicted dependence of the disparity ratio on white incarceration is almost flat. But the near constancy of the ratio is accidental. It is the result of the particular balance of crime and punishment extant in the U.S. between 1974 and 2001 that kept white incarceration within the bounds shown in the figure.
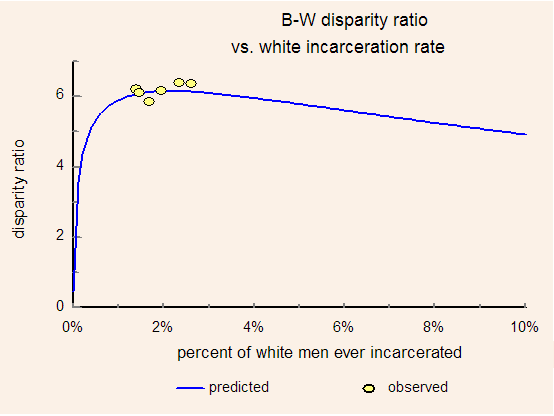
Figure 11. Observed black/white disparity ratios shown with the curve of predicted ratios.
Like the man who looks around him and concludes the earth is flat, the criminologist is blind to what will happen if incarceration rates spread beyond the limited domain of his experience. He is unaware that the black-to-white disparity ratio peaks at about 6, and that either growing or shrinking the prison population should cause the ratio to drop. He cannot know these things because he has not had the benefit of a coherent theory that puts incarceration into statistical perspective.
To lower the disparity ratio, La Griffe offers
two courses of action: Set the bar for incarceration so low that even jaywalkers are jailed. Or, set it
so high that only murder would warrant imprisonment.
Either way, dramatic reductions would ensue. If you are willing to settle
for only a 50% drop in the disparity ratio, that could
be achieved simply by adjusting the crime and punishment balance so
that 28% of adult white males would be sentenced to prison. And, if that should
prove too costly,
0.06% will achieve the same result.
We began this essay with three questions from Professors Oliver and
Yocom.
Q. Why would the black-white disparity in imprisonment grow over time?
A. Actually, with former inmates included in the count, the black-white disparity ratio has remained remarkably constant. But its stability is accidental and therefore not significant.
Q. Why would the prison system become increasingly targeted on Black people?
A. Nothing suggesting
targeting of black people matches the facts. When general levels of
incarceration increase, black and white incarceration rates follow a path
precisely accounted for by group criminality distributions. In the tough-on-crime
environment of the past 30 years, incarceration grew across the
board.
As levels of imprisonment rose, black and white incarceration rates traced out a predictable trajectory in diversity space.
Black imprisonment grew as predicted -- approximately six times as
fast as the white. (See Figure 4
or Figure 5.) None of this had anything to do with bias, racism, repressive injustice, racial profiling, political
repression or the economy. It was an inevitable consequence of underlying group criminality distributions.
Q. What has been going on
in United States race relations to make racial differences in imprisonment
so much worse in the years after the Civil Rights Movement?
A. Since criminality
distributions account quantitatively for racial disparities in
imprisonment, I suppose one could
argue that race relations have shaped the distributions, but La Griffe
leaves that to those better schooled in the casuistic arts.
Serial killers
Serial murder lends itself nicely to the analytical methods developed
here provided suitable data are available. Only
a few systematic accounts of the race and ethnicity of serial killers exist. There is an exhaustive study of African American
serial killers (Homicide Studies 2005; 9; 271) by criminologist Anthony
Walsh, and also Eric W. Hickey's book, Serial
killers and their victims, Brooks/Cole, 1997. That's about it.
Walsh identified 90 African American and 323 white American serial murderers, all men operating between 1945 and 2004. (Though Asians, Hispanics and Native Americans were not included in the study, their addition would not alter the fact that most serial killers are white men.) African American serial killers made up 22% of Walsh's sample, a figure in close agreement Hickey's enumeration. But, as blacks number well below 22% of the U.S. population, they are actually overrepresented among the ranks of serial killers -- roughly by a factor of 2.
So, why are most serial killers white men? The short answer is that serial murder is primarily a male enterprise, and in the U.S. white men outnumber black men seven to one. The long answer, however, is instructive**.
The ratio of black to white criminal offenders generally increases with the progression from passive white collar crime to pernicious violent crime. In 2003, for example, blacks were imprisoned for violent crimes at approximately 7 times the per capita rate of whites, but only 4 times the white rate for property crimes. Serial murder, by any reckoning, ranks at the top of this progression. Consequently, black serial murderers should, per capita, outnumber their white counterparts by at least a factor of seven. In actuality, the factor is closer to two. The appropriate question, then, is not why most serial killers are white men, but rather why black men are only twice as likely as white men to be serial murderers. Criminality distributions provide the answer. The mean criminality of black males is almost 1.3 SD greater than the white. But, with a black-to-white variance ratio of 0.46, white men display much greater variability. A symmetric way to view this is in terms of black homogeneity rather than white variability. Either way, at the extraordinarily high level of criminality peculiar to the serial murderer, white representation increases. We explore this in more detail in the next section.
Hispanic serial
killers
Though, data on Hispanic serial killers is scant,
we have learned enough to make some predictions concerning them. We ask two
questions: What is the minimum value of criminality in the population of serial
killers? And, what percentage
of white, black and Hispanic men achieve this criminality?
Consistent with Walsh's black to white serial-killer ratio of 90/323, the minimum criminality, Co, of serial murderers will satisfy the following relation:

where (Nb /Nw) is the ratio of black to white men in the general population, and Pb and Pw are the normalized criminality distributions of black and white males, respectively. Inserting a value for (Nb /Nw) of 0.15 -- approximately the historical average between 1945 and 2004 -- we find (as expected) the minimum criminality in the serial-killer population is way out on the right tail of the bell curve, approximately 3.6 SD from the white mean. Transforming to units of the black standard deviation, we find the minimum criminality of serial killers falls 3.4 SD out from the black mean, and in units of the Hispanic standard deviation, a whopping 4.1 SD out from the Hispanic mean. This means that roughly 0.018 percent of adult white males, 0.033 percent of adult black males and 0.0025 percent of adult Hispanic males have values of criminality in the range of serial murderers. Using Census Bureau population estimates, the percentages translate to 13,000 white, 4,000 black, and 350 Hispanic adult males with criminality in serial-murderer territory. Many of them -- bad hombres all -- are locked up. Only a small fraction are actually serial killers. The numbers are upper bounds to the actual numbers of serial murderers. The small upper bound on the number of Hispanic serial killers should warm hearts in the Nation of Aztlán.
We looked for data to test this bound. Hickey examined a sample of 226 male serial killers for which race and ethnicity could be determined. He found 73% of the offenders were white, 22% African American, 3% Hispanic, 1% Asian, and 1% other. Our prediction that Hispanics constitute a very small fraction of serial murderers is confirmed. The ratio of white to Hispanic offenders in Hickey's sample is 24 to 1. We would predict 37 to 1.
A final note
In the 45 years spanning 2005 to 2050,
Census Bureau demographers estimate that
the
number of males 18 years and older will increase by these percentages:
whites 8%, blacks 76%, and Hispanics 162%. We look forward to the
decrease in per capita serial murder.
##