Volume 1, Number 1 | |||||||||||||||||||||||||||||||||||||||||||||
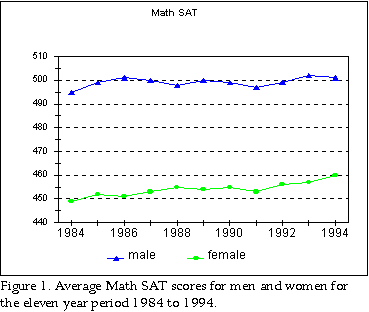
WOMEN AND MINORITIES IN SCIENCEProspects for women and minority doctoral scientists in engineering and other math-intensive areas are examined. A calculation of the ethnic-gender profile of this segment of the workforce is made for U.S. citizens and permanent residents. Rank ordering on mathematical reasoning ability predicts that women will top off at approximately 27 percent of this market. Similarly, rank ordering predicts almost 99 percent of math-intensive doctoral jobs will go to whites and Asians of primarily Chinese, Japanese, Korean and South Asian descent. Asians will continue to be represented in these fields well beyond their numbers in the general population. A study of the math-intensive academic marketplace predicts that women will top off there at about 22 to 23 percent.WOMEN Recruitment of women into science and engineering is a national mission. Equal pay for equal work is part of the story, but the principal goal is numerical equality for women, especially in fields where they have not fared well. Colleges, universities, government and industry are joined in the battle. Government and industry provide the money, universities the training. It is a team effort. From the University of Texas we read: "Diversity derived from inclusion of all groups is essential for solving the engineering challenges of the 21st Century. Women are a vital human resource for this endeavor. The Women in Engineering Program is an agent for intervention and a catalyst for transformation."From Rensselaer an invitation is extended: "A scholarship fund endowed by your corporation would be a major help in attracting women to Rensselaer. A scholarship of $5,000 per year for four years would allow your company to sponsor a Rensselaer scholarship named after your corporation."At Georgia Tech a University task force reports the following: "As part of a leading education and research institution in the nation, the College of Engineering at Georgia Tech will provide an environment conducive for women to pursue successfully and in a professional manner an engineering education and career."Seems harmless enough but let's look at how Georgia Tech increases enrollment of women engineers. It uses a favorite trick of the gender-equity crowd. They manipulate entrance requirements. In 1992, the Engineering School at Georgia Tech weighted the math SAT score 9.5 times greater than the verbal SAT score in the admissions formula. These relative weights were assigned on the basis of a grade-predicting regression analysis. Two years later in 1994, the admission index weighted the math score on the SAT only 3.8 times as much as the verbal score. Four years later in 1998, application essays and leadership ability were included in the admissions formula. Because women scored significantly lower than men on the math SAT, Georgia Tech manipulated admissions criteria to de-emphasize mathematical ability, and included new subjective criteria. Between 1994 and 1997 Georgia Tech established a double standard for admissions. In this period entering female students averaged 29 points (about 0.3 standard deviation) lower than their male counterparts on the math SAT. The same game is played at hundreds of colleges and universities across the country. Graduate schools are also swept up in the gender-equity game. A movement to increase graduate degrees among women in engineering and science is vigorous and widespread. These efforts have substantially narrowed the numerical gap between men and women new PhDs. Women currently account for more than 45 percent of new PhDs in the biological sciences. Attempts in the more mathematically based disciplines have been less successful. We isolate four technical fields that lean heavily on mathematical aptitude: engineering, physical science, computer science and mathematics. These disciplines span the math-intensive areas. The gender gap there is more resistant to closure. How much narrowing can we expect? Will women ever be proportionally represented in these technical fields? Will encouragement, financial incentives and admissions chicanery be enough to eliminate the gap? We will address these issues here. Evidence points to a gap between men and women in mathematical reasoning ability. Men seem to have the edge. Though statistical in nature, the gap is sufficiently large that most people suspect it simply from their life experience. Evidence, however, raises the issue above the level of suspicion. Simply put: On all standardized exams, including IQ tests, men score higher than women on mathematical reasoning sections. The effect crosses all races and cultures. It may be biological or environmental in origin, but that is another issue. We merely note that all efforts to erase the math gender gap have failed. In a bias-free employment market it is possible to calculate the maximum
proportion of women that we can expect to be employed at the doctoral level
in the collective areas of engineering, physical science, computer science
and mathematics. We will gauge the efforts of government, industry and
universities against the results of this calculation.
DEFINING THE GAP
 In 1998, more than a million college-bound high school seniors took the SAT I mathematical reasoning test, 541,962 men and 630,817 women. Men averaged 529.6 (SD = 114.1). Women averaged 494.5 (SD = 107.8). Since the two distributions have slightly different standard deviations, we computed the gap as the difference in the means divided by the root mean square of the two SDs, obtaining a male-female math gap of 0.32 SD. Math SAT scores range between 200 and 800. (You get 200 for writing your name.) Contrary to popular belief, 800 is not a "perfect score." It simply means that some threshold has been reached. Two students, each with scores of 800, will not necessarily have done equally well. A few years ago the College Board changed its scoring system. They called it "recentering." Ostensibly, recentering was designed to bring both the verbal and mathematical averages closer to 500. There were, however, other only rarely mentioned consequences. Recentering compresses the distribution of scores near the top, so that the best students become difficult to distinguish from one another. The new scoring system blurs the line between excellent and exceptional. Truly special students get lost in the crowd of very good students. In the year just before the SAT was recentered, 32 students nationwide scored a "perfect" 1600 on the combined math and verbal exams. The following year, after recentering, 545 students scored 1600, about 17 times more than under the old system. Coincidence or not, recentering is part of a leveling process in education, which attempts to minimize differences between students. With recentering, high scorers cluster together near the top of the distribution, making it easier for very selective schools to justify admitting more minorities. The SAT no longer distinguishes high-scoring minorities from higher achieving Whites and Asians. Nonetheless, despite all these limitations the SAT remains an extraordinary tool. Only about 30 percent of youngsters who are high school senior age take the exams. They are not representative of American youth. More girls than boys take the exams. Some students headed for college take the American College Testing Program (ACT) exams rather than SATs. Others who do not take SATs have taken themselves out of the college marketplace. Some have dropped out of school. For all these reasons SAT takers are not representative of their age group, and plausibly we might be criticized for using SAT results to assess a general gender difference. Addressing this problem, we can infer from a few mild assumptions the distributions of SAT scores that would be obtained if every person in the country of high school senior age took the exam. Most of the brightest students take SATs, even those from ACT states. A senior in an ACT state who is even thinking of applying out of state, will take SATs. Thus, we can assume with little error that just about all the brightest youngsters in the age group will take SAT exams. They will place in the high-end tail of the distribution. Consequently, the high end region of the curve will look more-or-less as it would if every last person in the age group took the exam. From the characteristics of the high-end tail we can reconstruct the full distribution as it would look for the entire high school senior age population. Let PM(x)dx be the probability of a
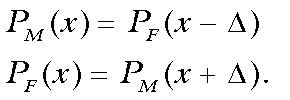
male obtaining an SAT score between x and x + dx.
Let PF(x)dx be the corresponding probability
for a female. (The quantity, x, is in SD units.) Now suppose that
each of the two distributions is Gaussian, with equal standard deviations.
Further, the distributions are displaced from one another by a gap, Δ,
such that:
 (1)
(1)The quantity, Δ, is the difference between the mean scores, male - female. Let fM and fF be the fractions of
males and females who obtain the score, l, or
better. Then,
 (2)
(2) (3)
(3)For convenience, we note the following transformation:
 (4)
(4)and write for fF,
 (5)
(5)In 1998, 0.765 percent of the entire resident population of male 17-year-olds in the U.S. took the SAT math exam and scored 750 or higher, compared with 0.318 percent of the corresponding females. That is, fM = 0.00765 and fF = 0.00318 for λ (in SD units) equivalent to a 750 SAT score. Further along the tail, 0.430 percent of the resident men in this age group scored 780 or better, compared with 0.164 percent of the corresponding women, i.e., fM = 0.00430 and fF = 0.00164 for λ equivalent to a 780 SAT score. We can be confident that both rarefied groups contain just about all of the nation's most mathematically talented 17-year-olds. From these data we can obtain the difference between male and female
means for the entire age group. Assuming a normalized Gaussian probability
density centered on zero, (2) may be solved numerically for λ,
the number of standard deviations the threshold score is displaced from
the mean score of PM. For a score of 750, we find λ
= 2.43; for a score of 780, λ = 2.63. Knowing
λ, (5) may be solved numerically for Δ,
the gap between the male and female means. The 750 cutoff yields Δ
= 0.303, and the 780 cutoff returns the value Δ
= 0.313. Both results are remarkably close to the gap of 0.32 SD observed
from the group of just test takers. We will use the value, Δ
= 0.31 SD.
Suppose NS slots are to be filled in order of ability
from a pool of NM men and NF women.
Assuming a distribution of ability, all those with ability equal to or
greater than some value, λ, will be selected
to fill a slot. The cutoff ability, λ, can be
determined from the pool sizes, the number of slots available and the ability
distributions for men and women. The variables are related as follows:
 (6)
(6)The first term on the left side of (6) represents the number of males who make the cutoff; the second term is the corresponding number of females. The two terms add up to the number of slots, NS. From the pool sizes, NM and NF, the number of available slots, NS, and the gap between the male and female distributions, Δ, we may find the cutoff ability, λ, by solving (6) numerically. Knowledge of λ allows evaluation of the first and second terms on the left side of (6) giving the number of men and women, respectively, selected to fill the slots. For NS = 181,800, the number of doctoral scientists employed in math-intensive areas in 1995, we calculated the expected percentage of females, assuming the slots would be filled in rank order of mathematical ability. The calculation proved not very sensitive to pool sizes so long as the ratio of men to women remained essentially constant. We formed the pools from men and women between the ages of 25 and 65, using 1996 population data. In this age range there were 68.7 million men and 70.8 million women resident in the U.S. in 1996. The quantities, NM and NF, were set to these values, respectively. The resulting calculation predicted that female doctoral scientists will saturate the math-intensive marketplace at approximately 27 percent. Conclusions
SUPER ELITE WOMEN
When finally appointed, a new junior faculty member must hit the ground running. He has a six year contract, but in reality he has only four and a half years to prove himself. A tenure decision will be made in the middle of his fifth year. It is the most critical time of his life. He has been preparing for this moment since he was an undergraduate. After the B.S., four or more years in graduate school, at least two years of postdoctoral training in another laboratory, and he is ready to fly on his own. Four and a half years later he will come up for promotion and tenure. It is up or out. Failure to get tenure means he must leave the university. If he fails, he will have the remaining year and a half of his contract to find a new job. Though publicly denied, in practice the candidate will be judged solely on the research criterion. It is a fair system because both the candidate and the department understand the rules from the outset. In the short time the candidate has been at the university, he is expected to have attracted independent funding, to have produced significant research output, and have established a national reputation in his field. A committee of peer plus department members and at least one outsider will decide his fate. Often students are included to help with the evaluation of teaching. However unless the candidate is a basket case in the classroom, he will satisfy the teaching criterion. The evaluation turns primarily on the assessment of outside referees, the most renowned investigators in the candidate's field. Each is asked to evaluate the candidate's work, with which they should already be familiar. The fundamental question is whether this candidate, in the past four plus years has done the quality work expected in academic research. If the answer is yes, the candidate will be advanced to tenure and promotion. Characteristically, about half the candidates make it. The elite group of academic scientists who obtain tenure represents the cream of American science. We ask at which point this market will saturate with women? To obtain the number of available slots in our rank order game, we must count the tenured faculty who work in math-intensive disciplines in American research universities. We can make a ballpark estimate of their number by looking at a product of their labors: new PhDs. For the last few years our universities have been turning out twelve to thirteen thousand PhD scientists a year in the math-intensive fields. Most are produced by senior faculty. Assuming an average of one new PhD per year per tenured faculty member, we estimate the number of slots to be 12,000 or so. The calculation proves only mildly sensitive to slot size, making the ballpark estimate sufficient. In the math-intensive areas, what is the fraction of tenured research-university faculty that we can reasonably expect to be female? Equation (6) again provides the answer. For a gap, Δ = 0.31, slot sizes, NS, between 8,000 and 17,000 (bracketing our ballpark estimate) and pool sizes, NM and NF, taken as the populations in the 25 to 65 age bracket, we predict that women will saturate this academic market at between 22 and 23 percent. With fewer slots available, women do not fare quite as well. Table 1 summarizes the results.
MINORITIES
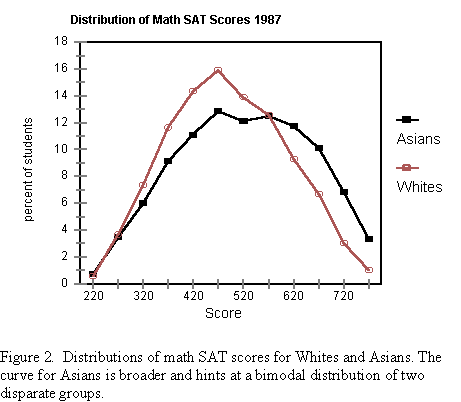
All the groups designated by the College Board have math SAT distributions with standard deviations clustered about 100, except the Asians/Pacific Islanders. And no wonder. Their standard deviation is closer to 120, showing their diverse nature. The distributions for 1987 for both Asians and Whites are shown in Figure 2, where the qualitative difference between the two distributions is apparent to the naked eye. The distribution for Asians is uncharacteristically broad, with a flattened top. It hints at bimodality.
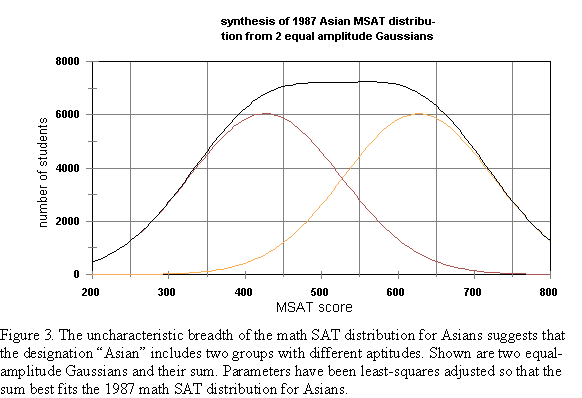
 An attempt was made to fit the "Asian" MSAT distribution for 1987 and
1992 (the years for which we had access to the ethnic distribution data)
to a sum of Gaussians. Since the elite Chinese, Japanese, Koreans and South Asians made
up about half this group, the Gaussians were given equal weight. (See Figure
3.) The least-squares fit suggests that this Asian quartet performed with
a mean of approximately 627 for 1987 and 641 for 1992. The remaining Asians
had mean scores of approximately 426 (1987) and 444 (1992), not unlike
American Indians. Choosing Whites as the reference group (Δ
= 0), and averaging over both years yielded Δ
= -1.24 for elite Asians, and 0.47 for other Asians. Other group Δ's
were obtained from 1998 MSAT mean scores as follows: Hispanic = 0.683,
Black = 0.99, and American Indian = 0.437. A rank order analysis, similar
to that used for the sexes, was performed using an extension of (6):
 (7)
(7)where PW is the normalized distribution function for Whites, Ni is the number in the pool from the ith group, and the sum is over all groups.
 The number of slots, NS, was set equal to 181,800,
the number of doctoral scientists employed in 1995 in the selected technical
fields. Again, we used the 25 to 65 age range for the pool numbers, this
time for each racial or ethnic group. We allowed for multi-talented people
to choose completely different fields by cutting the pool sizes for each
group proportionately and incrementally from the full populations down
to 1/5 of the full pool. The resulting predictions thus fall into ranges.
They are summarized in Table
Conclusions
|
| HOME
complete contents of La Griffe du Lion
DATA Science and Engineering Degrees 1988-97 Population by Age and Sex 1990 - 1999 Population by Age, Sex and Ethnicity 1996 SAT Means by Sex, Race and Ethnicity 1984 - 1994 SAT Means by Race and Ethnicity 1998
Write La Griffe |
|||||||||||||||||||||||||||||||||||||||||||